

By Chiara Parisi, Patrick Murphy, and Theodore Zarobell
Implementation is well underway for California’s historic $4 billion investment in the California Community Schools Partnership Program (CCSPP). The CCSPP grants allow schools to strengthen their practices around relationship building, integrated student support, family engagement, shared leadership, and expanded learning.
As part of an ongoing series, the Opportunity Institute posted an initial blog giving an overview of which local educational agencies (LEAs) received the first round of CCSPP grants. Subsequent blogs dug into how applicants planned to spend their planning and implementation grants. And the most recent blog provided a similar overview of the second round of CCSPP planning grants.
In every State Board of Education meeting to date, concerns have been raised by applicants and advocates about the participation of rural LEAs in the CCSPP. Several have claimed that rural applicants have been largely excluded from the program. In this piece, we take a closer look at how rural LEAs have fared in the first two rounds of CCSPP grants.
Who can receive CCSPP grants?
For an LEA to be eligible to receive a CCSPP grant, it must have at least 50 percent “unduplicated pupils” or above average rates of students dropping out, exclusionary discipline, or justice-involved, foster, or homeless youth. In California, unduplicated pupils are high needs students who are either eligible for free or reduced-price meals, English learners, and/or foster youth. If an LEA is ineligible overall, but a school within the LEA is eligible, that school can make the entire LEA eligible.
Beyond eligibility, the CCSPP prioritizes grant funding for applicants that meet certain criteria. Prioritized applicants include those that serve at least 80% high needs students, demonstrate a need for and commitment to integrated services, use collaborative leadership and family and community engagement practices, demonstrate a need for early childhood education, and identify a plan to sustain community school services after grant expiration. An additional priority was approved during a State Board of Education meeting for applicants serving small and rural schools. However, there are no details in the legislation on how the different priority criteria are weighed.
Rural LEAs were less likely to apply for CCSPP grants
In the first round of planning and implementation grants, rural LEAs were among the least likely to apply for CCSPP grants. Only 12 out of the state’s 58 counties failed to apply to the program and several of those counties were rural, including Alpine, Sierra, and Mariposa. While 8% of urban LEAs applied for implementation grants, only 5% of rural LEAs did. Similarly, while 12% of urban LEAs applied for planning grants, only 9% of rural LEAs did.

Several factors may have contributed to these numbers. The relatively short timeline between the announcement requesting applications to the due date for submissions may explain some of the difference. Rural schools typically have less administrative capacity and turning around a grant application in a hurry is challenging. Knowing that multiple rounds of applications were planned, the sense of urgency to get into the first round may have also been reduced. Further, grant funds with formula allocations can be seen as not worth the effort to small rural districts with low enrollment. Rural schools may have also been discouraged from applying because of the priority for LEAs that enroll at least 80% high-needs students—a number many rural LEAs do not meet.
Are rural LEAs underrepresented in CCSPP grant allocations?
There are various ways to assess whether rural LEAs are adequately represented in the CCSPP. One way is to compare the percentage of existing LEAs that received grants by geography. Under this measure, rural LEAs are underrepresented. For example, in round one, 12% of existing urban LEAs received planning grants, compared to only 5% of rural LEAs. Similarly, for implementation grants, out of the existing urban LEAs in the state of California, 4% received grants in round one, compared to 2% of rural LEAs. In round two of grant allocations, there were improvements in planning grant participation for rural schools: 11% of existing urban LEAs in California received planning grants in round two, compared to 10% of rural LEAs. Instead, for implementation grants, the relative share going to rural schools was unchanged and the gap between urban and rural schools worsened. Of the existing urban LEAs in California, 11% received implementation grants in round two, compared to only 2% of rural LEAs.

Another way to measure if rural LEAs are adequately represented is to look at the pool of LEAs that applied. Under this measure, applicants in rural areas were still less likely to receive grant funding than other types of LEAs. In round one of the CCSPP, while only 71% of rural LEA planning grant applicants received funding, 99% of urban and 92% of suburban LEA applicants did. Similarly, while 70% of urban and 81% of suburban applicants received implementation grants in round one, only 53% of rural applicants did.

Alternatively, you could measure representation by looking at the percentage of eligible LEAs (LEAs with more than 50% unduplicated high-needs students) that received grants. Again, under this measure, rural LEAs are underrepresented. Rural LEAs make up 19% of all eligible LEAs according to the National Center for Education Statistics, but have only received 14% of CCSPP grants to date. Suburban areas are well represented: they make up 27% of eligible LEAs, and received 26% of CCSPP grants. LEAs in towns and urban areas, on the other hand, are overrepresented. Towns, which make up only 12% of eligible LEAs, have received 16% of CCSPP grants. And urban areas, with only 38% of eligible LEAs, received 44% of CCSPP grants.

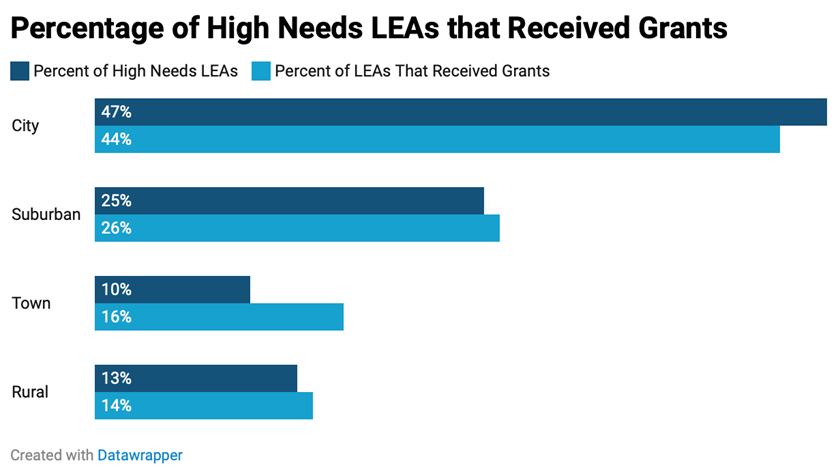
Last, you could measure representation by looking at the number of high-needs LEAs (LEAs with more than 80% unduplicated high-needs students). Under this measure, rural schools are adequately represented. There are 787 high-needs LEAs in California and 13% of them are in areas classified as rural. Rural LEAs received almost 14% of all CCSPP grants distributed thus far in planning and implementation grants. Similarly, 25% of high-needs LEAs are in suburban areas, and suburban LEAs received 26% of grants to date. And 47% of high-needs LEAs are in urban areas, and urban LEAs received 45% of grants thus far. On the other hand, only 10% of high-needs LEAs are in towns, but LEAs in towns received almost 16% of grants.
Accordingly, advocates have pointed to the prioritization of schools with high-needs students as the cause of gaps in participation for rural schools. In the first round of grants, CDE claimed to use cut scores and fund schools with 80% or higher high-needs students or 70% or higher for rural schools. For the second round, those numbers were lowered to 68% and 58%, and CDE also funded sites with a non-stability rate of 58% or higher.
But our analysis, using California Longitudinal Pupil Achievement Data System (CALPADS) data, shows a different picture. For example, CDE reported that in round one of implementation grants, 447 out of the 458 school sites that received grants were at or above the 80% high needs pupil count. However, according to our numbers, out of the total 586 LEAs receiving CCSPP grants, 248 had less than 80% high-needs students. And 47 of those LEAs currently have even less than 50% high-needs students as well. The difference in statistical findings is interesting and could be due to CDE using different sources of data.
Examples of Rural Schools and CCSPP
While some rural schools have been successful, others have failed to obtain grant funding. One success story can be found in Humboldt County. The Loleta Union Elementary District, a school with an unduplicated pupil percentage of 95%, had already begun constructing a network of community organizations to support their students long before CCSPP was even being discussed. Among their partners are the True North Organizing Network, Two Feathers Family Services, and the College of the Redwoods Multicultural and Equity Center. With their $713,000 CCSPP grant, they can more deeply invest in the community schools model they already have established.
Clovis Global Academy (CGA) is new to community schools and received a first round planning grant. They plan to use the grant as “a chance to approach teaching and learning the way it should be.” A dual-language immersion school, CGA found the principles of community schools to be nearly congruent with their own mission and vision. They will use the $200,000 they received to assess where additional funding, through an implementation grant, can help them better serve the students and families of their Fresno County community.
On the other hand, other rural LEAs with robust commitments to community schools have been left on the sidelines. For example, the West Kern Consortium, including Lost Hills Union Elementary, Semitropic Elementary, and Maple Elementary, previously received funding from the federal Full Service Community Schools Grant Program. The consortium is a great example of a community schools approach for rural districts. They were able to build a successful whole-child approach to education across districts, including initiatives on early childhood education, shared data, expanded learning, a children’s cabinet, math coaching, family partnerships, and social and health services.
The consortium of six districts applied for a CCSPP implementation grant in the hopes of expanding their community schools program to include initiatives on literacy, multi-tiered systems of support, mental health, and domestic abuse. All districts in the consortium but Maple Elementary were funded. Maple Elementary filed an appeal and asked that the scoring rubric be made publicly available. They were told that they did not receive funding because they only had 56% high-needs students, and a low stability rate of 6%, while the other districts in the consortium on average had 76% high-needs students. The exclusion of Maple Elementary from the CCSPP funding is a blow to the consortium's reliance on pooled funding and shared resources.
Looking forward
Overall, rural LEAs are underrepresented in the CCSPP. Again, in every State Board of Education meeting to date, concerns have been raised by rural applicants and advocates about the participation of rural LEAs in the program. The data shows that those concerns were warranted and the absence of rural schools among the grantees was systemic, rather than anecdotal rejections.
Though the CDE has publicly acknowledged the need for the increased representation of rural LEAs and added a priority in the scoring criteria, barriers remain for rural applicants. The Community Schools Learning Exchange argues that the CCSPP has no measure for the unique ecosystem of rural communities. Instead, the realities of urban and suburban districts are centered in the application criteria. Most policy in California is geared toward the most people. In other states, due to features of the state constitution, rural areas tend to be overrepresented in the state capital. But in California, each senate district represents a larger but relatively equal population. Designing programs for the mean or even median district can leave out rural schools. However, the CDE is also well-intentioned in prioritizing the highest needs schools. A commitment to equity, and an equitable distribution of funding, is a core feature of the CCSPP framework.
How should the CDE balance competing advocacy for which students should be prioritized in grant allocations? And given the apparent abundance of funding for the program overall, is the prioritization of certain eligible applicants over others necessary? If nothing else, CDE should be more transparent about how they are scoring applications and make clear what tradeoffs are being made.
Going forward, if the CDE wants to be more inclusive of rural schools, new approaches to increasing participation should be considered. Perhaps the unduplicated pupil count priority should be lowered. Or, more weight could be given to rural LEA classification in the scoring rubric compared to the other priorities. A few rural LEAs that were awarded planning grants in round one managed to secure implementation grants in round two—Regional Technical Assistance Centers might make a concerted effort to assist the remaining 67 rural LEAs with planning grants in applying for future rounds of implementation grants. Or perhaps special carve outs for rural schools need to be added to the CCSPP, like the Title V, Part B programs in the Every Student Succeeds Act (ESSA) specifically available for small and rural schools.
Even if rural LEAs are proportionally represented in future rounds of the CCSPP, they will still face challenges in meeting the unique needs of rural communities. While urban areas often have a developed infrastructure of social services, in rural communities, there is a lack of access to basic necessities. For example, rural schools can be located in food deserts or hours away from the nearest hospital. The absence of other services, like transportation, are also commonplace. Community schools programs were intended to fund the integration of existing social services into the education system, not the creation of new social services. Other funding streams aimed at increasing the infrastructure of public services more generally, like programs under the Children and Youth Behavioral Health Initiative, will also be crucial for rural communities seeking a whole-child education.